The key economic reports this week are the third estimate of Q1 GDP, May personal income and outlays, June vehicle sales, the June ISM manufacturing, and Case-Shiller House prices.
----- Monday, June 27th -----
10:30 AM ET:
Dallas Fed Survey of Manufacturing Activity for June.
----- Tuesday, June 28th -----
8:30 AM ET:
Gross Domestic Product, 1st quarter 2016 (Third estimate). The consensus is that real GDP increased 1.0% annualized in Q1, revised up from a 0.8% increase.
9:00 AM:
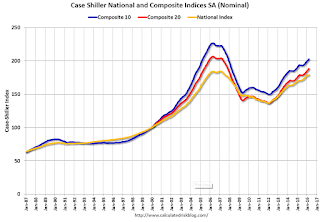
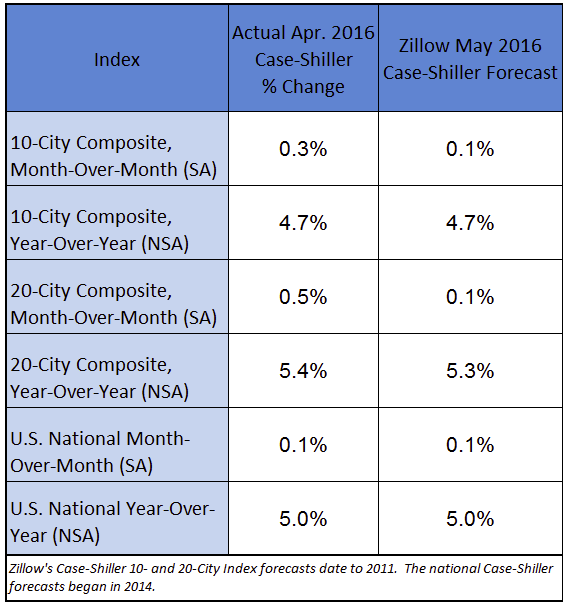
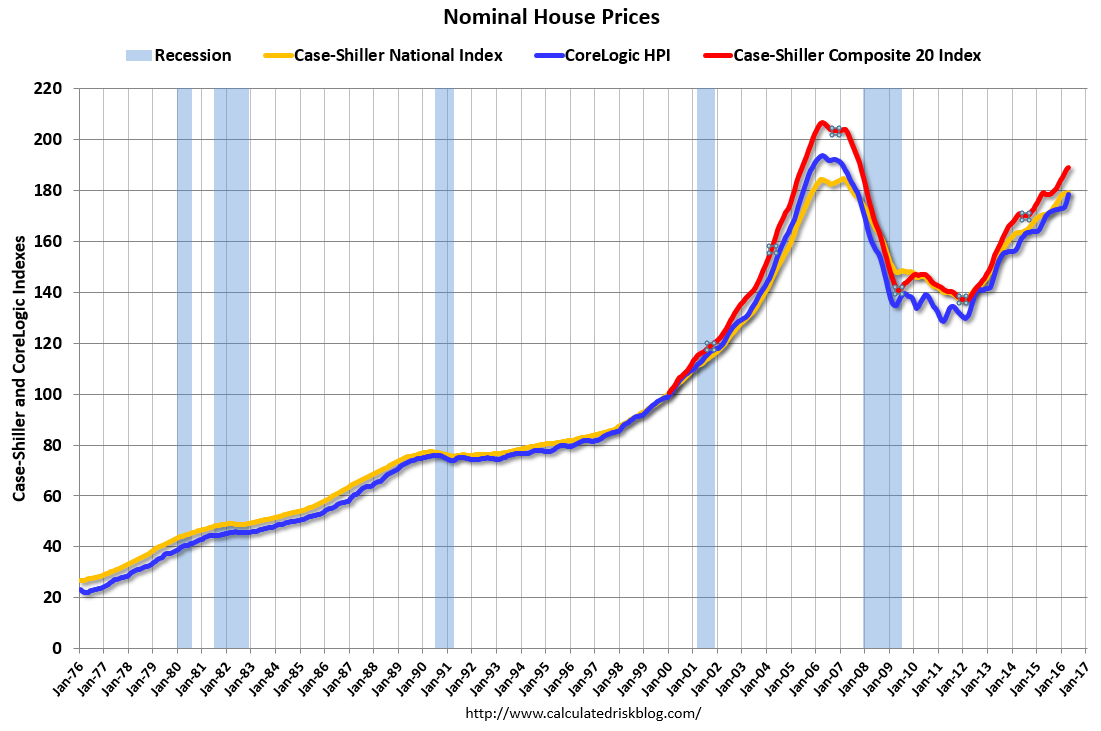
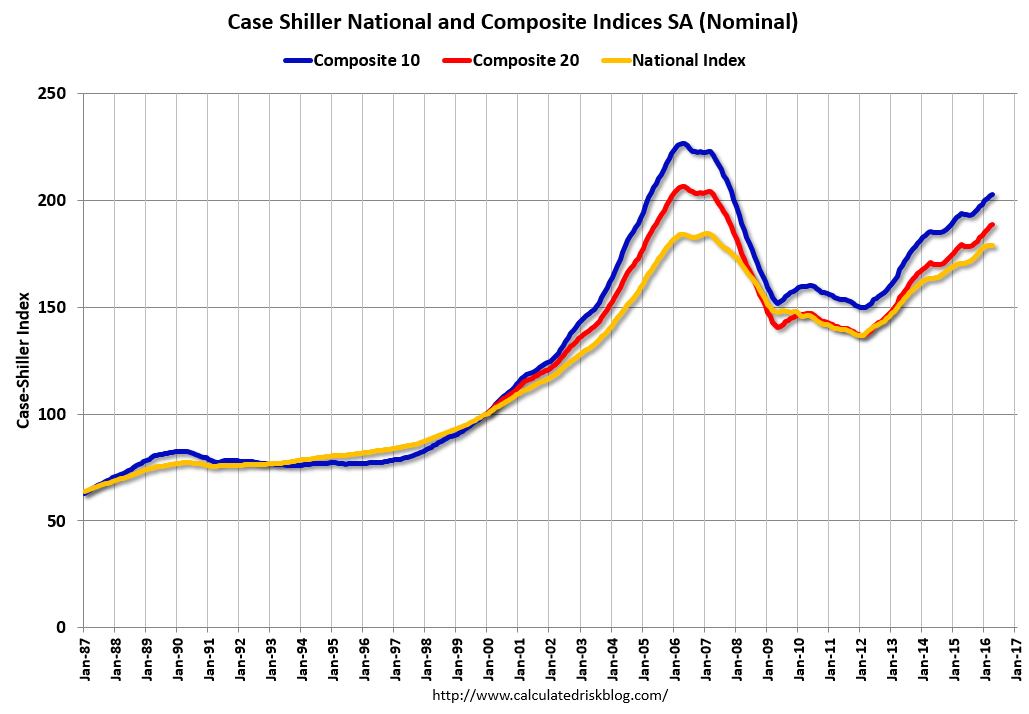
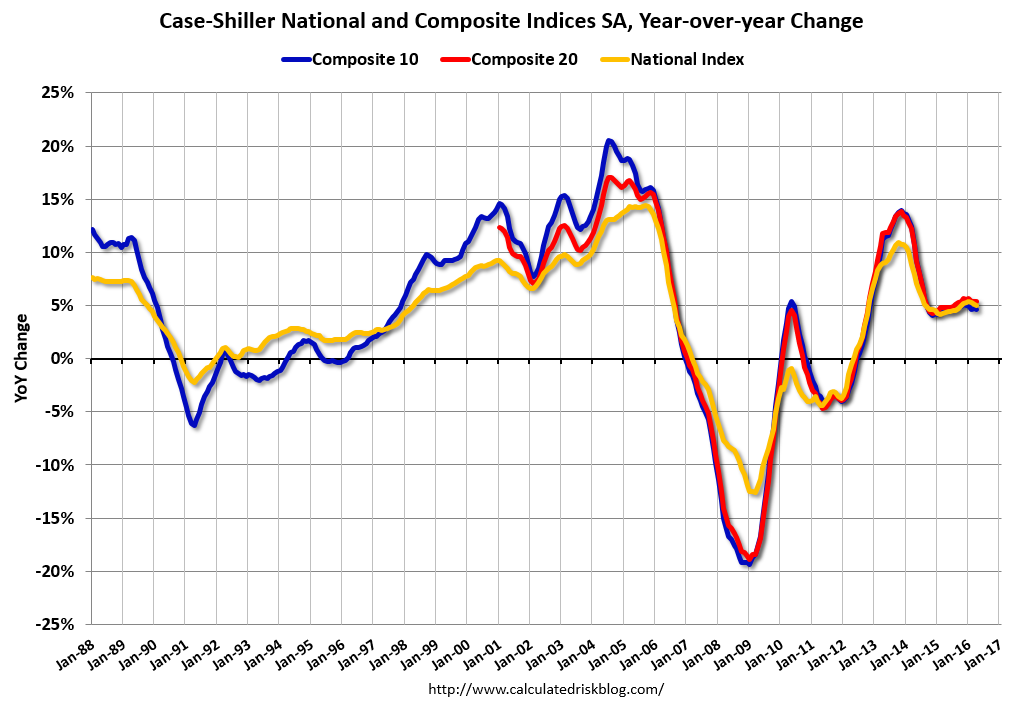
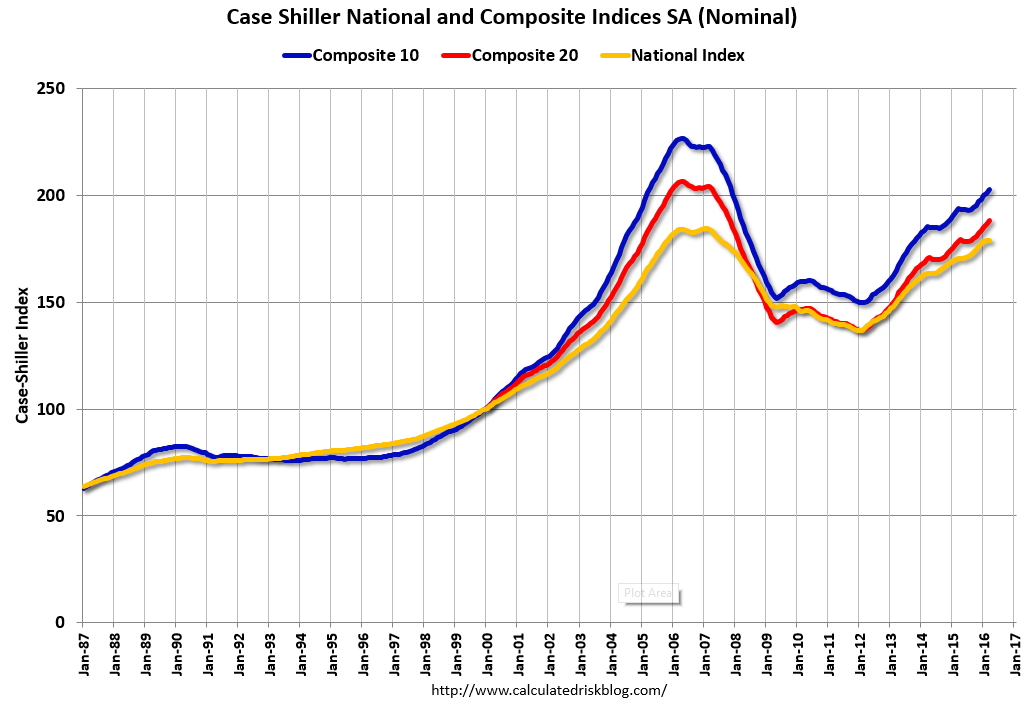
S&P/Case-Shiller House Price Index for April. Although this is the April report, it is really a 3 month average of February, March and April prices.
This graph shows the nominal seasonally adjusted National Index, Composite 10 and Composite 20 indexes through the March 2016 report (the Composite 20 was started in January 2000).
The consensus is for a 5.5% year-over-year increase in the Comp 20 index for April. The
Zillow forecast is for the National Index to increase 5.1% year-over-year in April.
10:00 AM:
Richmond Fed Survey of Manufacturing Activity for June. This is the last of the regional Fed surveys for June.
----- Wednesday, June 29th -----
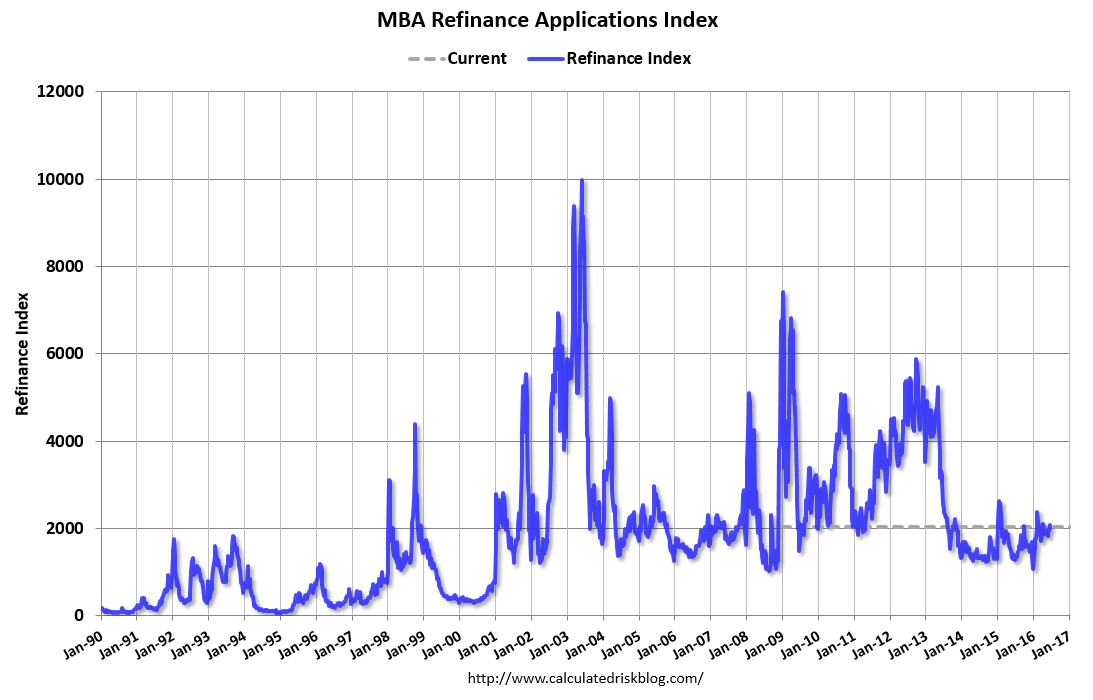
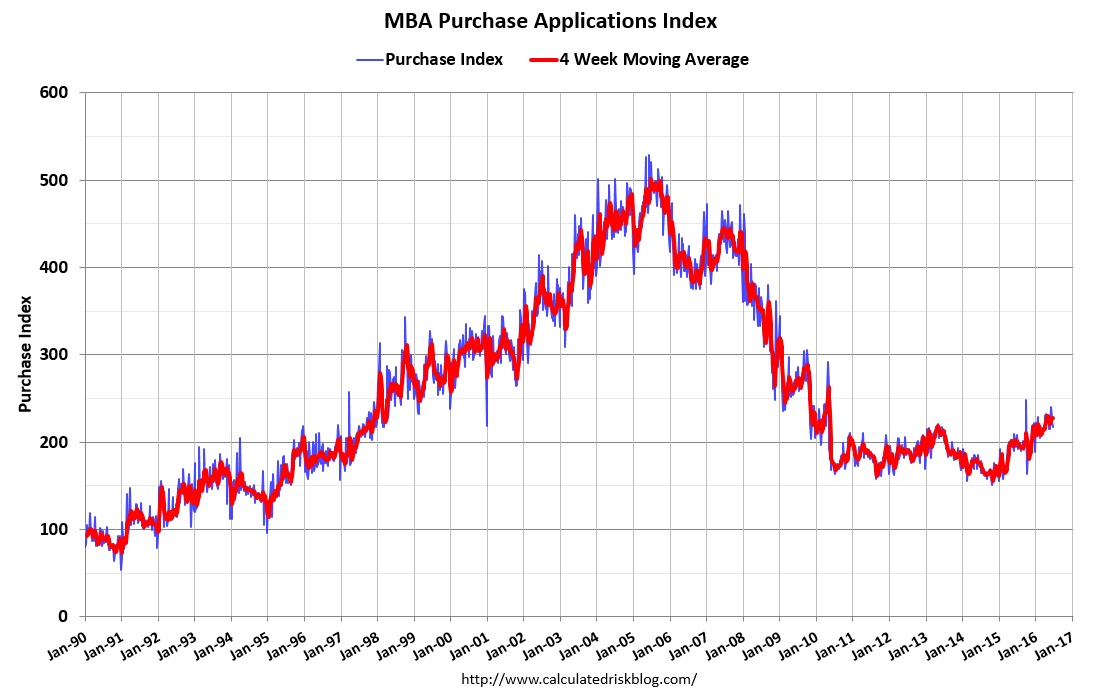
7:00 AM ET: The Mortgage Bankers Association (MBA) will release the results for the
mortgage purchase applications index.
8:30 AM:
Personal Income and Outlays for May. The consensus is for a 0.3% increase in personal income, and for a 0.4% increase in personal spending. And for the Core PCE price index to increase 0.2%.
9:30 AM:
Discussion, Fed Chair Janet Yellen, Policy Panel, ECB Forum on Central Banking, Linho Sintra, Portugal
10:00 AM:
Pending Home Sales Index for May. The consensus is for a 1.0% decrease in the index.
----- Thursday, June 30th -----
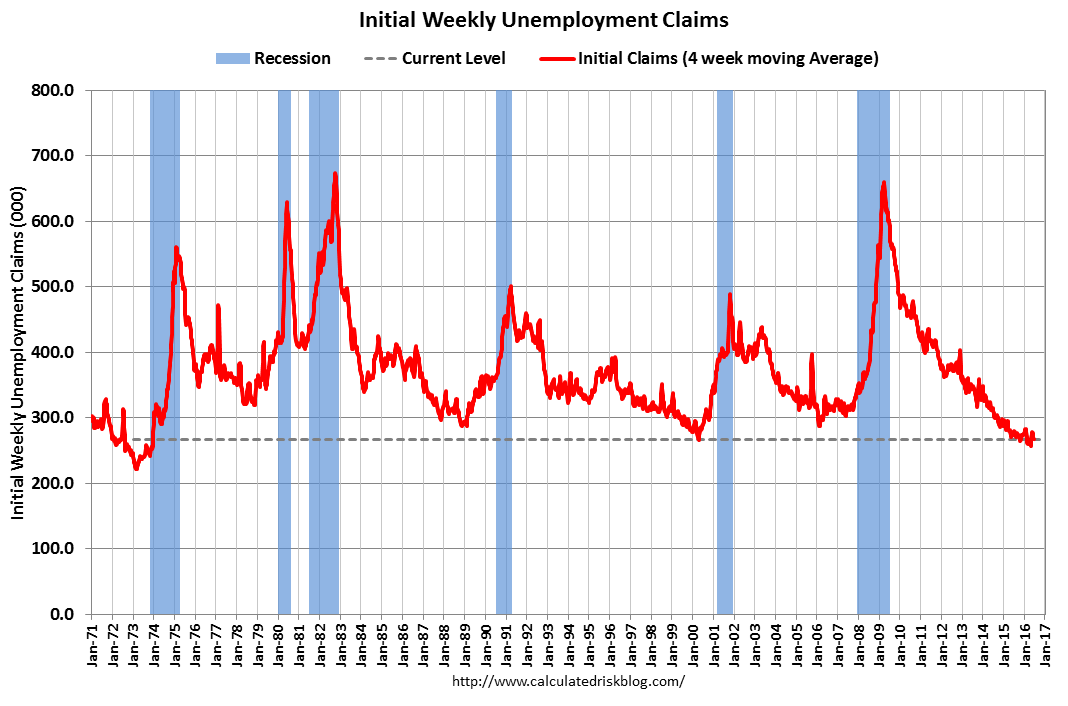
8:30 AM: The
initial weekly unemployment claims report will be released. The consensus is for 266 thousand initial claims, up from 259 thousand the previous week.
9:45 AM:
Chicago Purchasing Managers Index for June. The consensus is for a reading of 50.5, up from 49.3 in May.
----- Friday, July 1st -----
10:00 AM:
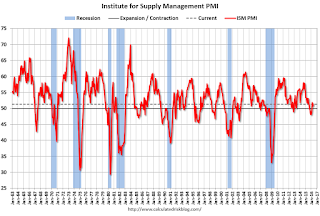
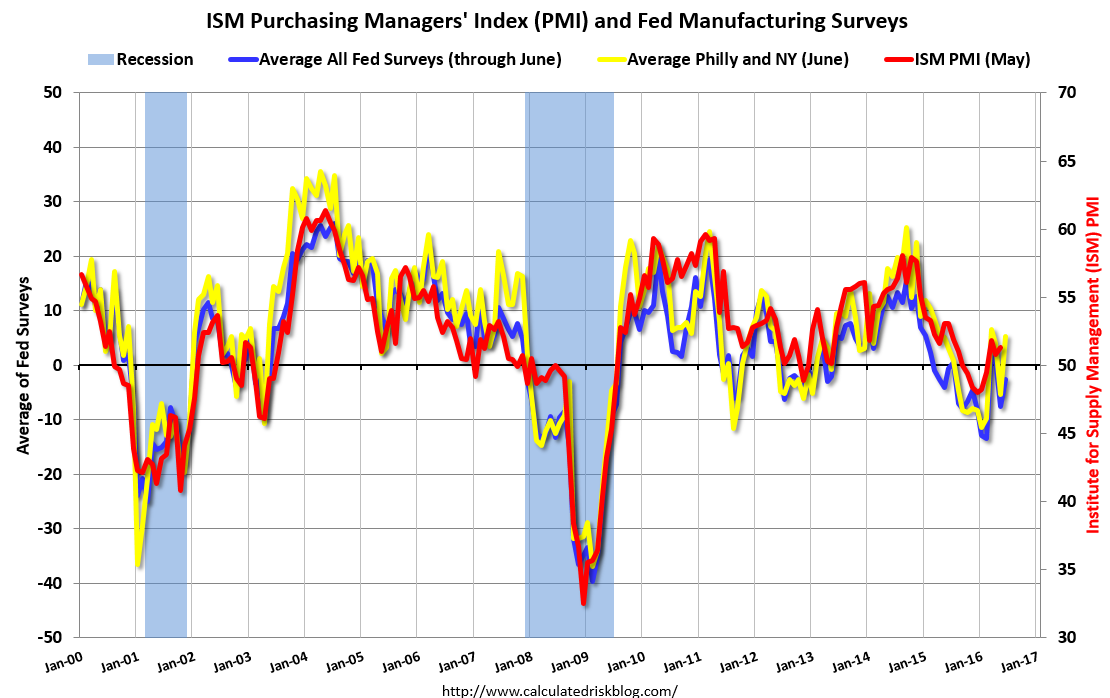
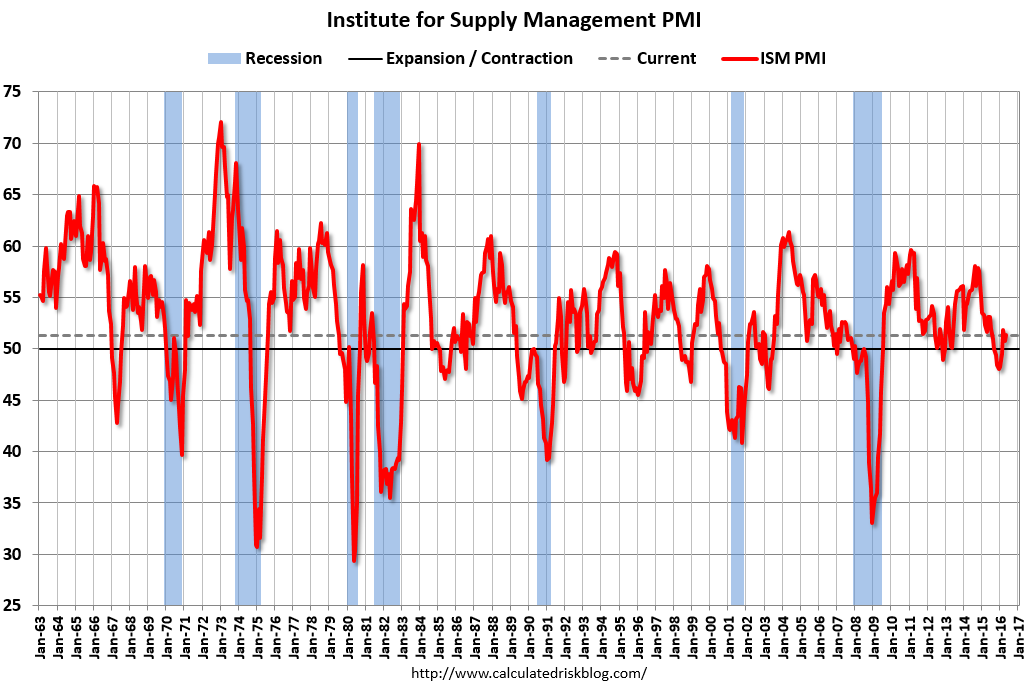
ISM Manufacturing Index for June. The consensus is for the ISM to be at 51.5, up from 51.3 in May.
Here is a long term graph of the ISM manufacturing index.
The ISM manufacturing index indicated expansion at 51.3% in May. he employment index was at 49.2%, and the new orders index was at 55.7%.
10:00 AM:
Construction Spending for May. The consensus is for a 0.6% increase in construction spending.
All day:
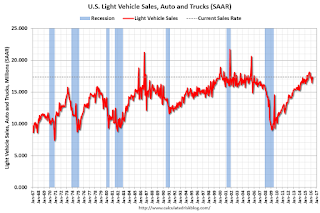
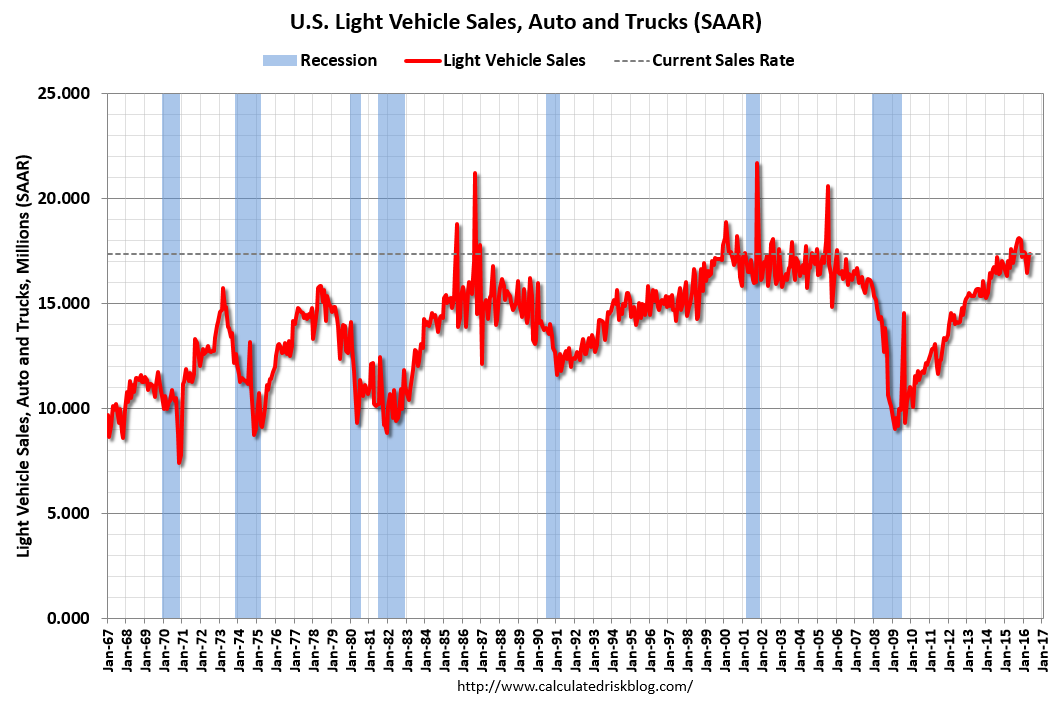
Light vehicle sales for June. The consensus is for light vehicle sales to decrease to 17.3 million SAAR in June from 17.4 million in May (Seasonally Adjusted Annual Rate).
This graph shows light vehicle sales since the BEA started keeping data in 1967. The dashed line is the May sales rate.

from
http://feedproxy.google.com/~r/CalculatedRisk/~3/QiIMMiZgxHk/schedule-for-week-of-june-26-2016.html


