A few positives include wage growth, a lower unemployment rate (however, for the wrong reason - a lower participation rate), and fewer long term unemployed.
Earlier: May Employment Report: 38,000 Jobs, 4.7% Unemployment Rate
In May, the year-over-year change was 2.40 million jobs.
Average Hourly Earnings
 This graph is based on “Average Hourly Earnings” from the Current Employment Statistics (CES) (aka "Establishment") monthly employment report. Note: There are also two quarterly sources for earnings data: 1) “Hourly Compensation,” from the BLS’s Productivity and Costs; and 2) the Employment Cost Index which includes wage/salary and benefit compensation.
On a monthly basis, wages increased at a 2.4% annual rate in May, and April was revised up.
The graph shows the nominal year-over-year change in "Average Hourly Earnings" for all private employees. Nominal wage growth was at 2.5% YoY in May. This series is noisy, however overall wage growth is trending up.
Note: CPI has been running under 2%, so there has been real wage growth.
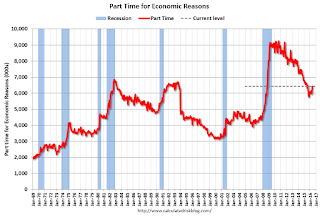
Part Time for Economic Reasons
 From the BLS report:
The number of persons employed part time for economic reasons (also referred to as involuntary part-time workers) increased by 468,000 to 6.4 million in May, after showing little movement since November. These individuals, who would have preferred full-time employment, were working part time because their hours had been cut back or because they were unable to find a full-time job.The number of persons working part time for economic reasons increased sharply in May. This level suggests slack still in the labor market.
These workers are included in the alternate measure of labor underutilization (U-6) that was unchanged at 9.7% in May.
Unemployed over 26 Weeks
 This graph shows the number of workers unemployed for 27 weeks or more.
According to the BLS, there are 1.885 million workers who have been unemployed for more than 26 weeks and still want a job. This was down from 2.063 million in April, and the lowest since July 2008.
This is generally trending down, but is still high.
There are still signs of slack (as example, part time workers for economic reasons increase sharply, and elevated U-6), but there also signs the labor market is tightening (decline in long term unemployed, slight pickup in wages).
Overall this was a disappointing report.
from
http://feedproxy.google.com/~r/CalculatedRisk/~3/-2kOafgtADo/comments-disappointing-employment-report.html
No comments:
Post a Comment