I wrote an update in 2014, and argued vehicle sales would "mostly move sideways" for the next few years.
Here is another update to the U.S. fleet turnover graph.
This graph shows the total number of registered vehicles in the U.S. divided by the sales rate through July 2016 - and gives a turnover ratio for the U.S. fleet (this doesn't tell you the age or the composition of the fleet). Note: the number of registered vehicles is estimated for 2015 and 2016.
The wild swings in 2009 were due to the "cash for clunkers" program.
 Click on graph for larger image in graph gallery.
The estimated ratio for July close to 14 years - back to a more normal level.
Note: in 2009, I argued the turnover ratio would "probably decline to 15 or so eventually" and that has happened.
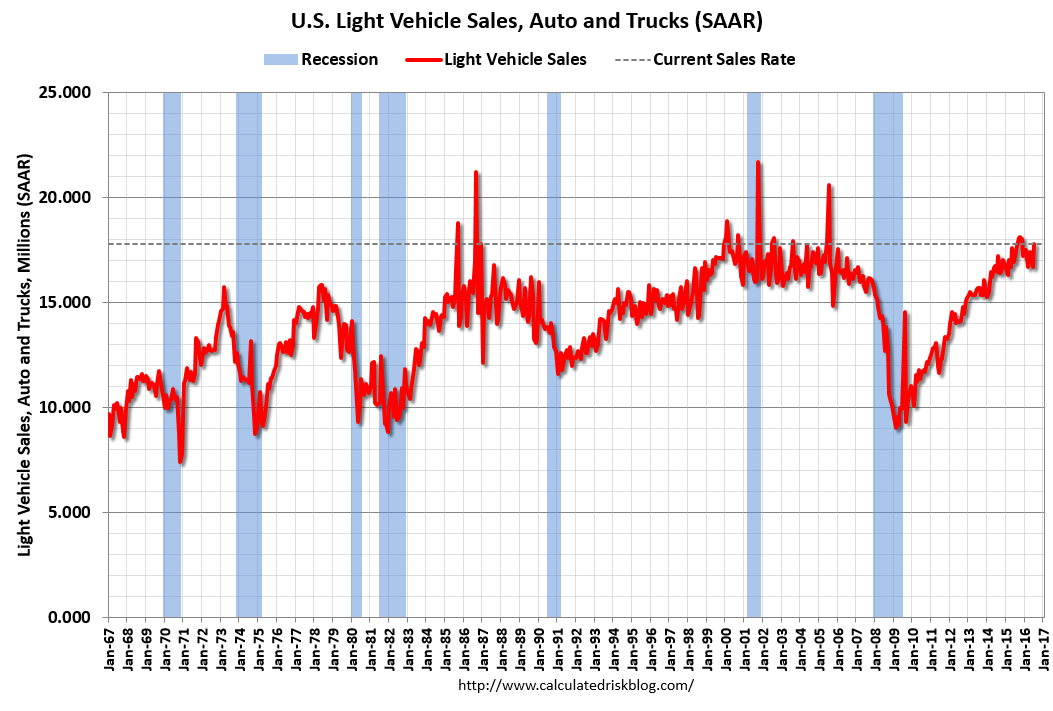 The second graph shows light vehicle sales since the BEA started keeping data in 1967. The dashed line is current estimated sales rate.
The current sales rate is now near the top (excluding one month spikes) of the '98/'06 auto boom.
Light vehicle sales were at a 17.7 million seasonally adjusted annual rate (SAAR) in July.
I continue to expect vehicle sales to mostly move sideways over the next few years.
from
http://feedproxy.google.com/~r/CalculatedRisk/~3/ezrLy4DskLg/vehicle-sales-fleet-turnover-ratio.html
No comments:
Post a Comment