The key report this week is the October employment report on Friday.
Other key indicators include the October ISM manufacturing and non-manufacturing indexes, October auto sales, and the September trade deficit.
The FOMC meets on Tuesday and Wednesday, and no change to policy is expected.
----- Monday, Oct 31st -----
8:30 AM ET:
Personal Income and Outlays for September. The consensus is for a 0.4% increase in personal income, and for a 0.5% increase in personal spending. And for the Core PCE price index to increase 0.1%.
9:45 AM:
Chicago Purchasing Managers Index for October. The consensus is for a reading of 54.3, up from 54.2 in September.
10:30 AM:
Dallas Fed Survey of Manufacturing Activity for October. This is the last of the regional Fed surveys for October.
----- Tuesday, Nov 1st -----

10:00 AM:
ISM Manufacturing Index for October. The consensus is for the ISM to be at 51.6, up from 51.5 in September.
Here is a long term graph of the ISM manufacturing index.
The ISM manufacturing index indicated expansion at 51.5% in September. The employment index was at 49.7%, and the new orders index was at 55.1%.
10:00 AM:
Construction Spending for September. The consensus is for a 0.6% increase in construction spending.
All day:
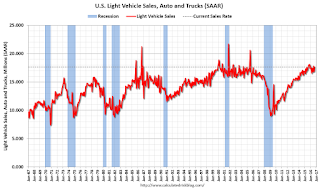
Light vehicle sales for October. The consensus is for light vehicle sales to decrease to 17.6 million SAAR in October, from 17.7 million in September (Seasonally Adjusted Annual Rate).
This graph shows light vehicle sales since the BEA started keeping data in 1967. The dashed line is the September sales rate.
----- Wednesday, Nov 2nd -----
7:00 AM ET: The Mortgage Bankers Association (MBA) will release the results for the
mortgage purchase applications index.
8:15 AM: The
ADP Employment Report for October. This report is for private payrolls only (no government). The consensus is for 170,000 payroll jobs added in October, up from 154,000 added in September.
2:00 PM:
FOMC Meeting Announcement. No change to policy is expected at this meeting.
----- Thursday, Nov 3rd -----
8:30 AM ET: The
initial weekly unemployment claims report will be released. The consensus is for 255 thousand initial claims, down from 258 thousand the previous week.
10:00 AM:
Manufacturers' Shipments, Inventories and Orders (Factory Orders) for September. The consensus is a 0.2% increase in orders.
10:00 AM: the
ISM non-Manufacturing Index for October. The consensus is for index to decrease to 56.1 from 57.1 in August.
----- Friday, Nov 4th -----
8:30 AM:
Employment Report for October. The consensus is for an increase of 178,000 non-farm payroll jobs added in October, up from the 156,000 non-farm payroll jobs added in September.
The consensus is for the unemployment rate to decline to 4.9%.

This graph shows the year-over-year change in total non-farm employment since 1968.
In September, the year-over-year change was 2.45 million jobs.
A key will be the change in wages.

8:30 AM:
Trade Balance report for September from the Census Bureau.
This graph shows the U.S. trade deficit, with and without petroleum, through July. The blue line is the total deficit, and the black line is the petroleum deficit, and the red line is the trade deficit ex-petroleum products.
The consensus is for the U.S. trade deficit to be at $38.9 billion in September from $40.7 billion in August.

from
http://feedproxy.google.com/~r/CalculatedRisk/~3/M9T_Wf36OvE/schedule-for-week-of-oct-30-2016.html


