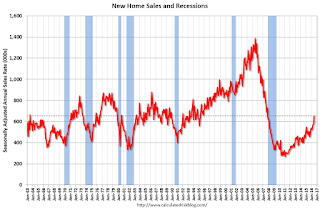
The new home sales report for July was very strong at 654,000 on a seasonally adjusted annual rate basis (SAAR) - the highest since October 2007 - however combined sales for April, May and June were revised down by 12 thousand SAAR.
Sales were up 31.3% year-over-year (YoY) compared to July 2015. And sales are up 12.4% year-to-date compared to the same period in 2015.
 Click on graph for larger image.
The first graph shows New Home Sales vs. recessions since 1963. The dashed line is the current sales rate.
As always, I wouldn't read too much into data for any one month - this series is volatile and the revisions are frequently significant.
However it does appear new home sales are approaching normal levels (I've been expecting sales to increase to at least 800 thousand - but I expected the recovery to be slow).
 The second graph shows new home sales for 2015 and 2016 by month (Seasonally Adjusted Annual Rate). Sales to date are up 12.4% year-over-year, mostly because of the solid growth starting in Q2.
There will probably be solid year-over-year growth in Q3 this year too.
Overall I expected lower growth this year, in the 4% to 8% range. Slower growth seemed likely this year because Houston (and other oil producing areas) will have a problem this year.
So far new home sales have been stronger than my forecast.
 The third graph shows existing home sales, on a Seasonally Adjusted Annual Rate (SAAR) basis since 1993.
Sales in July (5.39 million SAAR) were 3.2% lower than last month, and were 1.6% below the July 2015 rate.
For existing homes, inventory is still key. I expected some increase in inventory last year, but that didn't happened. Inventory is still very low and falling year-over-year (down 5.8% year-over-year in June). More inventory would probably mean smaller price increases and slightly higher sales, and less inventory means lower sales and somewhat larger price increases.
Two of the key reasons inventory is low: 1) A large number of single family home and condos were converted to rental units. Last year, housing economist Tom Lawler estimated there were 17.5 million renter occupied single family homes in the U.S., up from 10.7 million in 2000. Many of these houses were purchased by investors, and rents have increased substantially, and the investors are not selling (even though prices have increased too). Most of these rental conversions were at the lower end, and that is limiting the supply for first time buyers. 2) Baby boomers are aging in place (people tend to downsize when they are 75 or 80, in another 10 to 20 years for the boomers). Instead we are seeing a surge in home improvement spending, and this is also limiting supply.
And here is another update to the "distressing gap" graph that I first started posting a number of years ago to show the emerging gap caused by distressed sales. Now I'm looking for the gap to close over the next several years.
 The "distressing gap" graph shows existing home sales (left axis) and new home sales (right axis) through July 2016. This graph starts in 1994, but the relationship had been fairly steady back to the '60s.
Following the housing bubble and bust, the "distressing gap" appeared mostly because of distressed sales.
I expect existing home sales to move more sideways, and I expect this gap to slowly close, mostly from an increase in new home sales.
However, this assumes that the builders will offer some smaller, less expensive homes. If not, then the gap will persist.
 Another way to look at this is a ratio of existing to new home sales.
This ratio was fairly stable from 1994 through 2006, and then the flood of distressed sales kept the number of existing home sales elevated and depressed new home sales. (Note: This ratio was fairly stable back to the early '70s, but I only have annual data for the earlier years).
In general the ratio has been trending down, and this ratio will probably continue to trend down over the next several years.
Note: Existing home sales are counted when transactions are closed, and new home sales are counted when contracts are signed. So the timing of sales is different.
from
http://feedproxy.google.com/~r/CalculatedRisk/~3/zXH2yTFfk-I/comments-on-home-sales-in-july.html
No comments:
Post a Comment